Architectural diagrams are visual representations that provide a comprehensive overview of a system's structure, components, and relationships. They are a powerful communication tool, enabling stakeholders, especially in a web app development firm, to understand and align on the complex system's design, functionality, and interconnections.
Architectural diagrams are significant because they can simplify intricate systems, making them easier to comprehend, analyze, and modify. By presenting a high-level view of the system, these diagrams facilitate effective decision-making, risk assessment, and resource allocation during the design and implementation phases.
Key Types of Architectural Diagrams
Architectural diagrams come in various forms, each serving a specific purpose and catering to different use cases. In collaboration scenarios—especially during vendor due diligence—comparing how leading teams describe scalability and system boundaries (for example, via top companies for scalable web app development) can make architectural conversations more concrete and decision-ready. Here's an overview of some common types of architectural diagrams:
To better understand and compare these architectural diagram types, consider the following table:
| Diagram type | Description | Real-world examples |
|---|---|---|
| Application architecture | Logical structure of an application | E-commerce platform, CRM system |
| Network architecture | Physical/virtual network infrastructure | Corporate LAN, data center network |
| Cloud architecture | Systems in cloud environments | Web application hosted on AWS |
| Enterprise architecture | Complex enterprise ecosystems | Banking system, healthcare IT |
| Data flow diagram (DFD) | Data movement between systems, users, processes | Online payment processing, supply chain management |
| Software architecture | System architecture for Agile, DevOps, CI/CD | Microservices-based application, containerized deployment |
Each type of architectural diagram serves a distinct purpose and provides valuable insights for stakeholders, from developers and architects to business leaders and decision-makers.
Application architecture diagram
An application architecture diagram is a visual representation that depicts an application system's logical structure and organization. It illustrates the various modules, components, and their interactions within the application. This type of diagram is beneficial for understanding software applications' high-level design and architecture.
The primary purpose of an application architecture diagram is to provide a conceptual overview of how the different parts of the application fit together and communicate with each other.
It helps stakeholders, developers, and architects comprehend the application's structure, identify dependencies, and understand the data flow and control between components.
In an application architecture diagram, components are typically represented as boxes or nodes, while their interactions are shown using arrows or lines. These components can represent various elements such as user interfaces, business logic layers, data access layers, third-party integrations, and external systems.
Network architecture diagram
A network architecture diagram illustrates a network infrastructure's physical or virtual components. It visually represents the various hardware devices, such as servers, hosts, databases, and the communication paths that connect them.
In a network architecture diagram, you'll typically find elements like routers, switches, firewalls, load balancers, and other networking devices that facilitate data transmission and communication between different network parts. These diagrams help identify the physical locations of servers, data centers, and other critical infrastructure components.
The network architecture diagram may depict logical connections and virtual appliances instead of physical hardware for virtual or cloud-based networks. It can showcase the relationships between virtual machines, containers, and the underlying virtualization layer.
Cloud architecture diagram
A cloud architecture diagram visually represents a system or application deployed in a cloud computing environment, such as Amazon Web Services (AWS), Microsoft Azure, or Google Cloud Platform (GCP).
Cloud architecture diagrams typically depict the components and services used in the cloud infrastructure, including virtual machines, containers, serverless functions, databases, storage services, load balancers, and networking components.
When creating a cloud architecture diagram, it's essential to consider the specific cloud provider's services and resources being used. For example, an AWS architecture diagram may include components such as EC2 instances, Lambda functions, S3 buckets, RDS databases, and various networking services like VPCs, subnets, and load balancers.
Similarly, an Azure architecture diagram may incorporate resources like Virtual Machines, App Services, Azure Functions, Azure SQL Databases, and Azure networking components like Virtual Networks and Load Balancers.
Enterprise architecture diagram
An enterprise architecture diagram provides a high-level, comprehensive view of an organization's complex ecosystem, encompassing various systems, applications, and data integrations. It serves as a blueprint for understanding and aligning the intricate relationships between different components within the enterprise.
Enterprise architecture diagrams are particularly valuable for large organizations with interconnected systems and applications. They help stakeholders visualize the overall enterprise architecture, enabling them to identify potential areas for optimization, streamlining processes, and ensuring seamless data flow across the organization.
These diagrams depict various elements, including business processes, information flows, applications, databases, infrastructure components, and interdependencies. They highlight how different systems and applications interact, exchange data, and contribute to the organization's operations.
Software architecture diagram
A software architecture diagram is a visual representation of the structure and components of a software system. It is specifically designed to support Agile methodologies, DevOps practices, and Continuous Integration/Continuous Deployment (CI/CD) pipelines.
It illustrates the various components, services, and communication flows involved in software application development, deployment, and maintenance.
In an Agile context, software architecture diagrams help teams understand the overall system architecture, enabling effective collaboration and decision-making during iterative development cycles. They provide a shared understanding of the system's components, their interactions, and how changes in one area may impact others.
DevOps practices emphasize the integration of development and operations teams, and software architecture diagrams are crucial in bridging this gap. They depict the infrastructure components, deployment environments, and the flow of code and artifacts through the CI/CD pipeline.
Software architecture diagrams typically include components such as:
- Code repositories: Represent version control systems like Git, where the application's source code is stored and managed.
- Build servers: Illustrate the tools and processes responsible for compiling, packaging, and creating executable artifacts from the source code.
- Artifact repositories: Depict storage locations for built artifacts, such as Docker registries or package repositories.
- Deployment environments: Represent the different stages of the deployment pipeline, such as development, staging, and production environments.
- Monitoring and logging: Illustrate the tools and processes used to monitor application performance, log events, and collect metrics.
How to Create an Architectural Diagram
Creating an architectural diagram is a multi-step process that requires careful planning and execution. Here are the key steps to follow:
- Gather requirements: Start by understanding the diagram's purpose and goals. Identify the stakeholders, their needs, and the level of detail required. Collect relevant information about the system, applications, infrastructure, and data flows.
- Define the scope: Clearly define the scope of the diagram. Determine the boundaries of the system or architecture you want to represent. Decide which components, services, and interactions should be included or excluded.
- Choose the diagram type: Based on the scope and requirements, select the appropriate type of architectural diagram. Different diagram types serve different purposes, such as application architecture, network architecture, cloud architecture, enterprise architecture, data flow diagrams, or software architecture diagrams.
- Design iteratively: Begin creating the diagram by laying out the essential components and their relationships. Use standardized symbols, notations, and styling conventions. Iterate and refine the diagram as you gather more information or receive stakeholder feedback.
- Review with stakeholders: Regularly review the diagram with stakeholders, subject matter experts, and team members. Gather feedback, clarify any ambiguities, and ensure the diagram accurately represents the system or architecture.
- Finalize and document: Once the diagram is complete and approved, document any necessary explanations, assumptions, or notes. Ensure that the diagram is easily accessible and understandable to all relevant parties.
Best Tools for Creating Architectural Diagrams
When it comes to creating architectural diagrams, having the right tools can significantly improve efficiency, collaboration, and overall effectiveness. Here are some of the top tools used for this purpose, along with their pros and cons, ease of use, collaboration features, and platform compatibility.
Lucidchart
Canva, Canva Pro license
Lucidchart is a widely popular cloud-based diagramming tool that offers a user-friendly interface and a wide range of features for creating architectural diagrams. Its drag-and-drop functionality and extensive shape libraries make it easy to visualize complex systems and architectures.
Pros
- Intuitive and user-friendly interface
- Robust collaboration features for real-time editing and commenting
- Integrations with popular tools like Google Drive, Confluence, and Jira
- Cross-platform compatibility (web, desktop, and mobile apps)
Cons
- Limited free version with restricted features
- Steep learning curve for advanced features and customizations
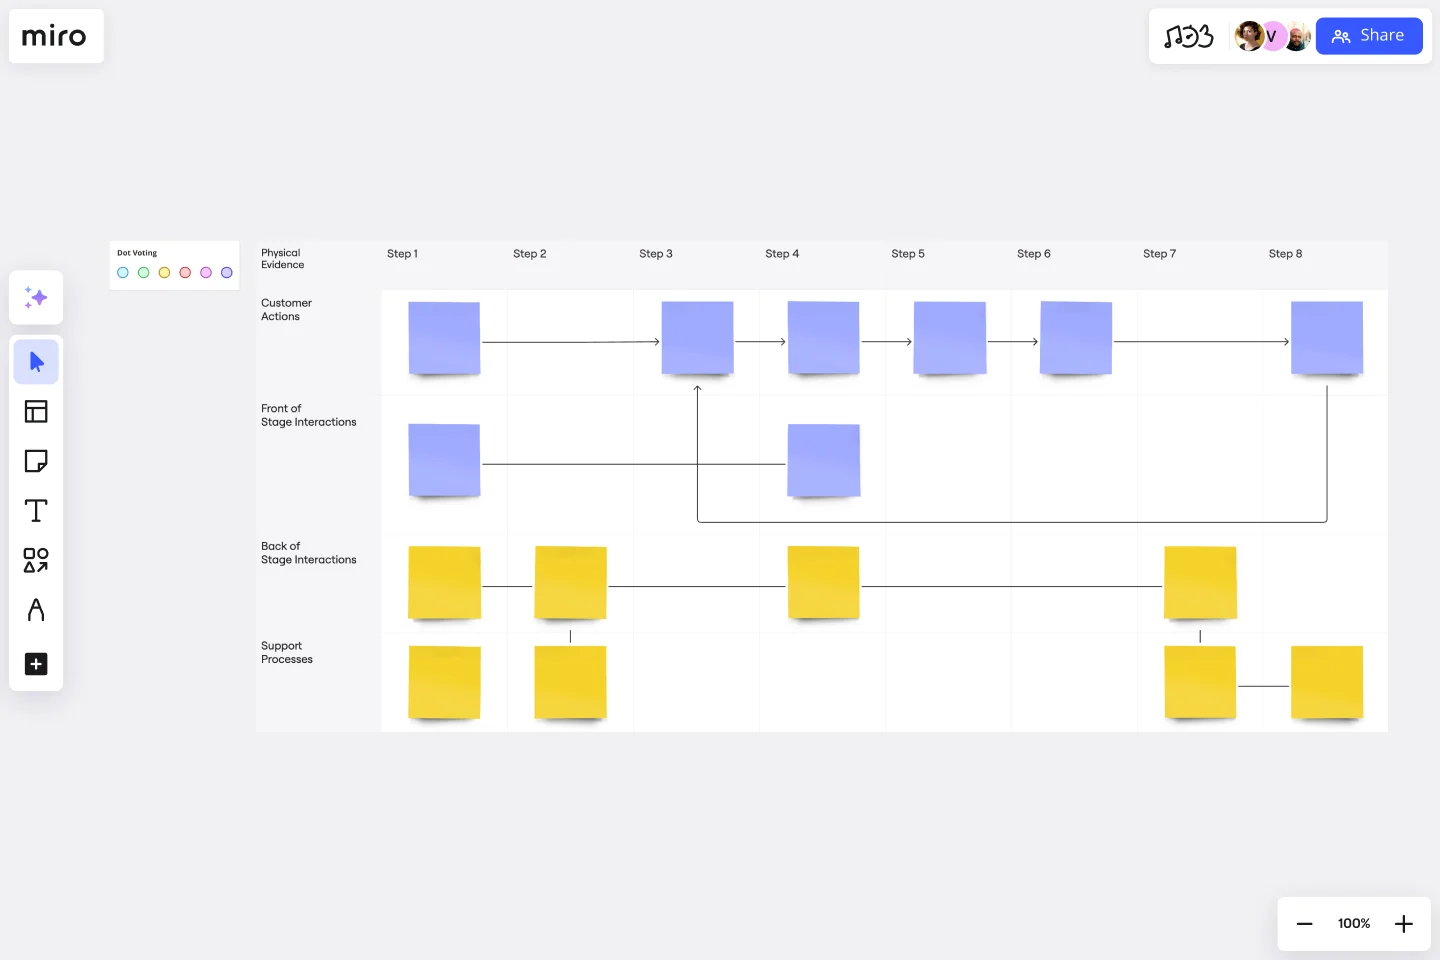
Miro
Canva, Canva Pro license
Miro is a versatile online whiteboard platform for creating architectural diagrams and various other collaborative activities. Its infinite canvas and freeform nature make it a flexible choice for visualizing complex systems.
Pros
- Intuitive and easy-to-use interface
- Excellent collaboration features for real-time editing and video conferencing
- Integrations with popular tools like Jira, Trello, and Slack
- Cross-platform compatibility (web, desktop, and mobile apps)
Cons
- Limited shape libraries and templates specifically for architectural diagrams
- Potential performance issues with large, complex diagrams
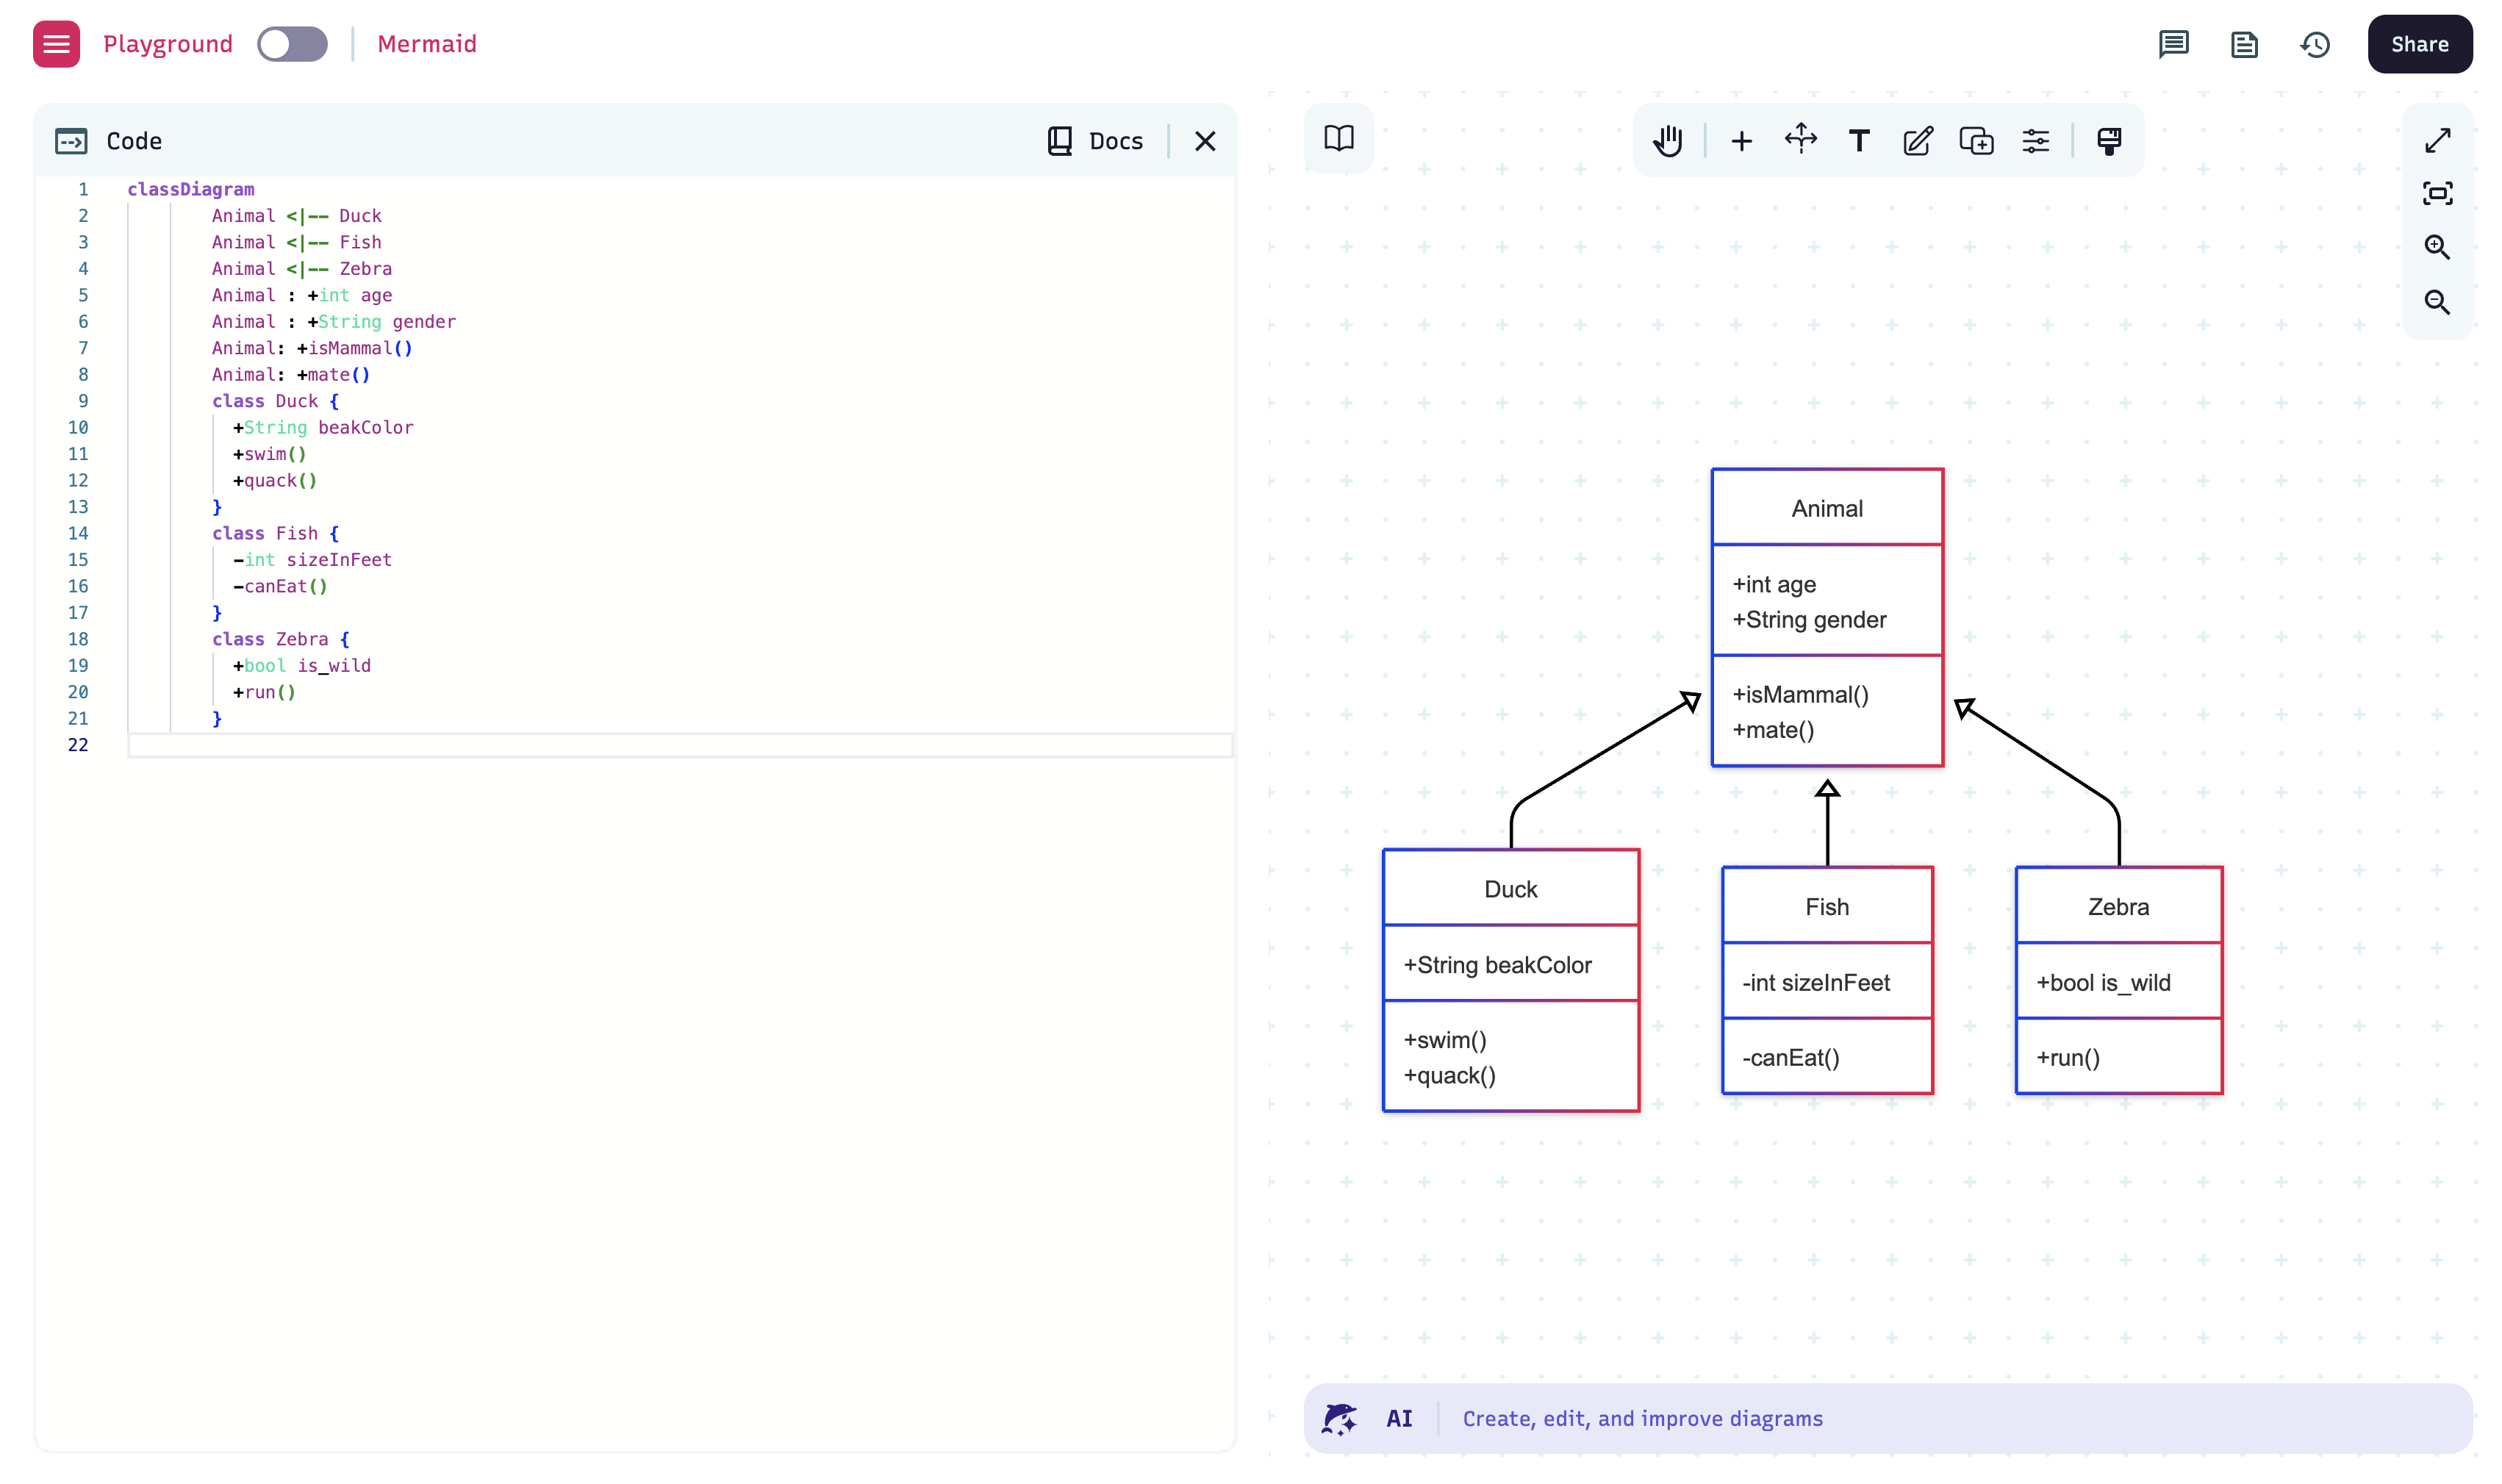
Mermaid.js
Canva, Canva Pro license
Mermaid.js is a unique tool for creating architectural diagrams using text-based syntax. It's beneficial for developers who prefer a code-centric approach and want to integrate diagrams directly into their project documentation or README files.
Pros
- Lightweight and easy to integrate into existing projects
- Version control and collaboration through code repositories
- Supports a wide range of diagram types, including sequence, class, and state diagrams
- Cross-platform compatibility (web, desktop, and mobile apps)
Cons
- Steeper learning curve due to the text-based syntax
- Limited customization options compared to graphical tools
- Potential compatibility issues with older browsers or environments
Microsoft Visio
Microsoft Visio is a powerful desktop application that has long been used to create architectural and other types of diagrams. It offers comprehensive features and templates, making it a versatile tool for technical and non-technical users.
Pros
- Extensive shape libraries and templates for various diagram types
- Advanced features for creating complex diagrams and customizations
- Integration with other Microsoft Office applications
- Support for collaboration through SharePoint and OneDrive
Cons
- Steep learning curve for advanced features
- Limited cross-platform compatibility (primarily Windows-based)
- An expensive licensing model, especially for individual users or small teams
Best Practices for Effective Architectural Diagramming
- Keep diagrams focused and straightforward. Avoid cluttering diagrams with unnecessary details or information that could distract from the primary purpose. Aim for clarity and conciseness, highlighting only the most relevant components and relationships.
- Apply standardized symbols and notations. Utilize widely recognized symbols, icons, and notations specific to your architectural diagram. Consistent use of standard notations helps stakeholders and team members easily understand diagrams.
- Use consistent styling. Maintain a cohesive visual style throughout your diagrams, including consistent use of colors, fonts, line weights, and other styling elements. Consistent styling enhances readability and professionalism.
- Regularly update diagrams to reflect system changes. As your systems evolve, it's crucial to keep architectural diagrams up-to-date. Outdated diagrams can lead to confusion and misunderstandings, so make it a practice to review and update diagrams regularly, incorporating changes and new requirements.
- Tailor the diagram's detail level to the target audience. When creating architectural diagrams, consider the intended audience and their level of technical expertise. For non-technical stakeholders, focus on high-level overviews, while for technical teams, provide more detailed diagrams showcasing specific components and interactions.
Conclusion
Architectural diagrams are invaluable tools for system planning and communication. They provide a clear, visual representation of complex systems, enabling stakeholders to understand the architecture, identify potential issues, and make informed decisions.
Choosing the right tool and adhering to best practices and methodologies is crucial for creating practical architectural diagrams. The appropriate tool should offer features that support collaboration, version control, and easy sharing while providing a user-friendly interface for creating and modifying diagrams.
Finally, well-designed architectural diagrams are essential for successful system planning and communication. They bridge the gap between technical and non-technical stakeholders, foster collaboration, and ensure that everyone involved has a shared understanding of the system's architecture, enabling more informed decision-making and smoother project execution.
Jul 15, 2025

Creates insightful, strategy-driven content that translates complex design and branding concepts into accessible knowledge, supporting Ramotion’s mission to elevate digital experiences.