
Web application acceleration is the practice of shortening and stabilizing the time it takes a person to finish an important task. The task may be signing in, loading a dashboard, finding a record, or exporting a report. A fast landing page means little if the workflow stalls after the first click.
Useful analysis separates the journey into four layers: the browser, the network, edge infrastructure, and the backend. Each layer can delay the same screen, so a team that starts with a favorite fix may optimize the wrong component.
Effective web performance optimization starts with measurements from the real journey, followed by a controlled change and another measurement.
What Is Web Application Acceleration?
Web application acceleration combines technical and operational changes that reduce task completion time while preserving stability and availability. It may include smaller browser bundles, fewer network round trips, a content delivery network, better database queries, or a safer caching strategy. The right mix depends on evidence from the application.
The term overlaps with application performance optimization, but they are not identical. Application performance optimization covers code, databases, infrastructure, and operations across the whole system.
Network acceleration focuses on transport, routing, protocols, and distance. Some vendors also use "application acceleration" as a product category, which can hide very different capabilities behind one label.
Success needs more than one score. Judge web application performance through:
- Time to complete the critical task, including all screens and API calls
- Stability across devices, regions, releases, and traffic levels
- Availability and error rate during normal traffic and load spikes
- User-visible responsiveness after the initial page has loaded
A single Lighthouse run, average API time, or synthetic test cannot represent all users. Combine browser telemetry, network traces, server data, and error monitoring to see the complete path.
Choose User-Centric Performance Metrics
Start with what users experience. Measure loading speed, interaction response, visual movement, server response time, and failed actions. Add business timings such as login completion or dashboard-ready time, because technical metrics can improve while the actual workflow remains slow.
As verified on September 17, 2026, Google's Core Web Vitals thresholds classify a page as good when Largest Contentful Paint is at most 2.5 seconds, Interaction to Next Paint is at most 200 milliseconds, and Cumulative Layout Shift is at most 0.1. Assessment uses the 75th percentile.
Segment that percentile by device class, page type, geography, account tier, and authenticated state so a large group of fast visits does not conceal a slow but valuable workflow.
- LCP captures when the main content appears.
- INP captures responsiveness across user interactions.
- CLS captures unexpected visual movement.
- TTFB and API percentiles help locate server and network delay.
- Error rate shows whether apparent speed came at the cost of reliability.
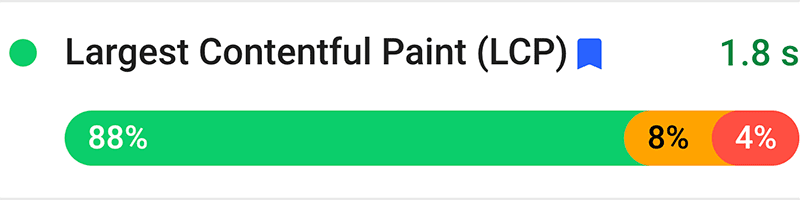
Core Web Vitals field data distributed across good, needs improvement, and poor ranges (Source)
Field data vs. Lab data
Field data records real sessions across varied devices, networks, locations, cache states, and behavior. Real user monitoring and the Chrome User Experience Report can expose long-tail problems and show whether web app performance changed after a release. Field data is noisy, affected by traffic mix, and slower to accumulate.
Lab data runs a repeatable scenario under controlled conditions. Lighthouse, browser performance traces, and scripted synthetic tests are useful for diagnosis, regression checks, and before-and-after comparisons. They represent the selected device, route, network profile, and test script, not the full user population.
Use field data to find affected segments and validate impact. Use lab data to reproduce a slow path, inspect the main thread and waterfall, and test a hypothesis. Google's field and lab data guidance explains why the two can differ even when both are valid. A strong lab result may miss slow devices, cold caches, poor connectivity, third-party variability, or authenticated data volume.
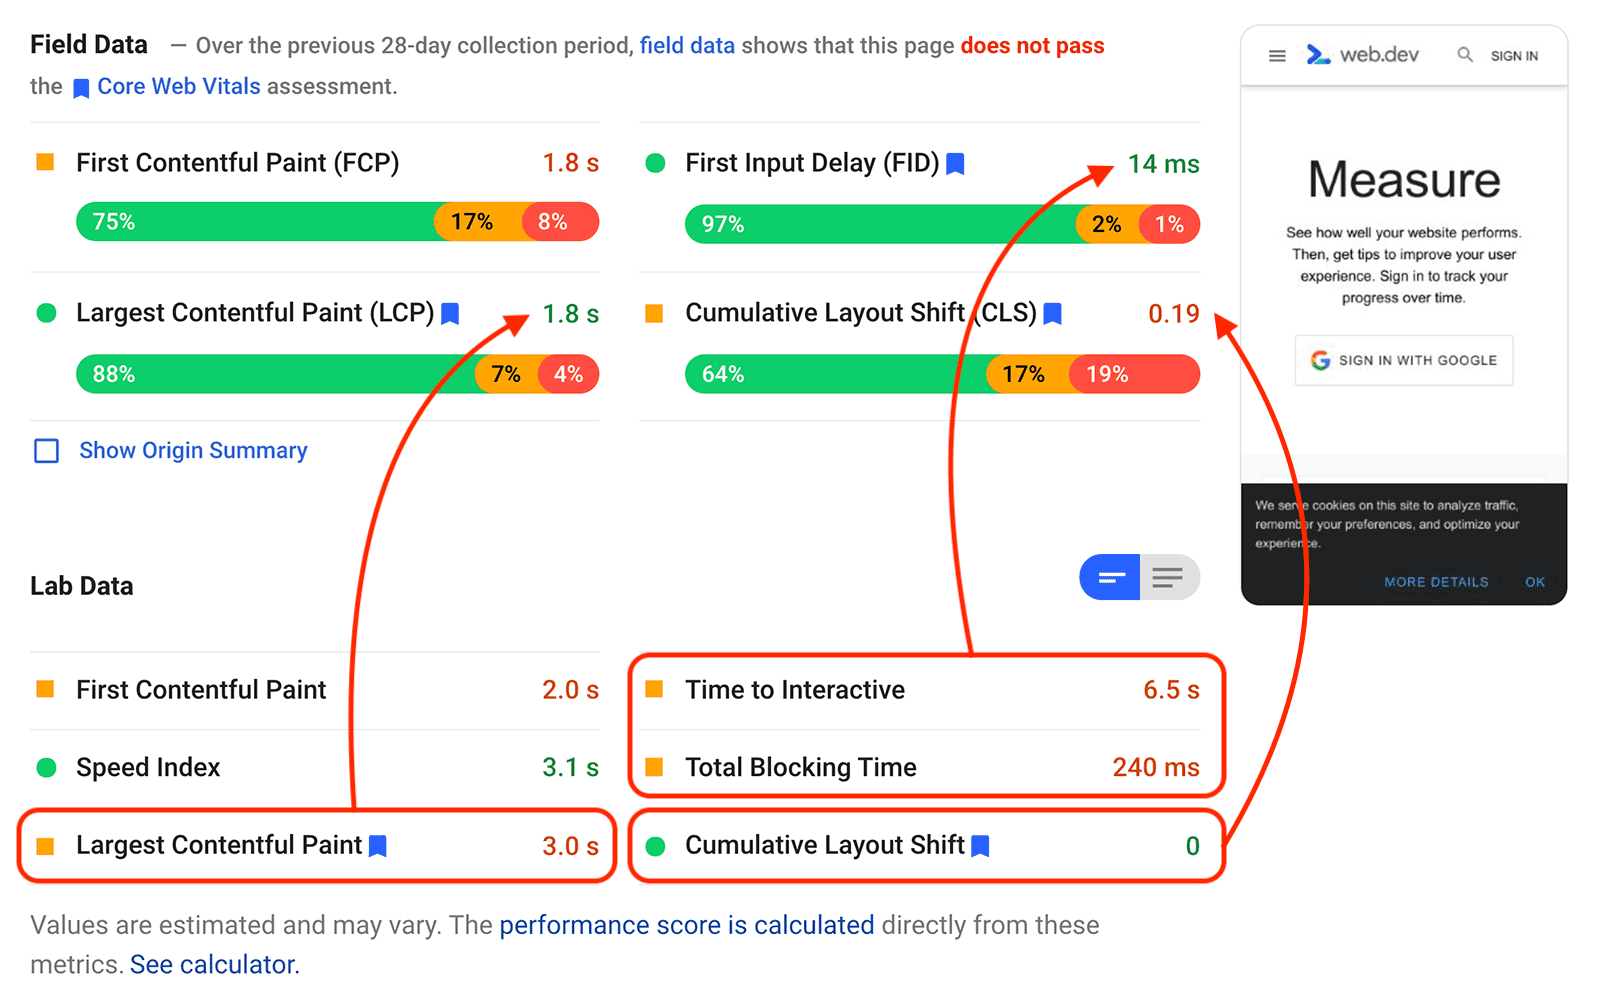
PageSpeed Insights showing field and lab data for the same page (Source)
Set a Performance Budget
A performance budget turns intent into limits that teams can test before release. It should cover transferred bytes, request count, main-thread work, API latency, and errors. Every web application performance limit needs a measurement source and an owner who can act when the threshold fails.
This sample budget is for an illustrative corporate dashboard on a mid-range mobile device and a representative throttled network. Teams should replace these values after measuring their own users and workflows.
| Metric | Example target | Measurement source | Owner |
|---|---|---|---|
| Initial compressed transfer | 700 KB or less | Browser network trace | Front-end lead |
| Initial requests | 55 or fewer | Synthetic journey | Front-end lead |
| Long-task blocking time | 200 ms or less | Lab trace | UI platform team |
| Dashboard API p75 | 500 ms or less | APM trace | API owner |
| Dashboard API p95 | 1,200 ms or less | APM trace | API owner |
| Journey error rate | Below 0.5% | RUM and error monitoring | Product team |
Treat this web application performance budget as a release signal, not a decorative document. Review it when the product adds major features or the user population changes. Website speed optimization often fails when teams record page weight but never assign responsibility for keeping it within bounds.
Find the Performance Bottleneck
Reproduce the exact scenario before changing code. Record the user role, dataset size, device, network profile, cache state, region, and release version. Run it several times, keep the distribution, and establish a baseline for total task time and each major stage.
Use a trace to divide elapsed time into network latency, server processing, resource transfer, browser parsing, JavaScript execution, layout, and paint. Correlate browser request IDs with edge and backend traces when possible. Then look for slow requests, waterfalls, long tasks, repeated queries, retry loops, and wide variance between runs.
- State a testable hypothesis, such as "the dashboard waits on a serial API chain."
- Change one meaningful constraint at a time.
- Compare percentiles and errors, not the fastest run.
- Reject fixes that move delay to another step in the journey.
This process prevents a common mistake in application acceleration: compressing assets when the real delay is a database lock, or tuning a query when the browser spends seconds processing its response.
Reduce Network Latency and Data Transfer
Web performance optimization accounts for geographic distance, DNS, connection setup, TLS negotiation, request queuing, and transfer. HTTP/2 or HTTP/3 can improve protocol behavior, but neither cancels distance or makes an oversized payload cheap. Count requests and bytes before buying more bandwidth.
Remove unused fields, duplicate calls, oversized images, unnecessary third-party scripts, and serial dependencies. Compress text responses and choose image formats that fit browser support and content.
Payload reduction can beat a faster connection because it reduces transfer time for every user, lowers parsing work, and often cuts memory use on constrained devices. Practical latency reduction work includes:
- Co-locate dependent services when cross-region calls dominate traces.
- Reuse connections and avoid redirect chains.
- Batch requests only when batching does not delay early useful data.
- Prioritize critical resources and defer nonessential transfers.
Web app performance does not require the smallest page at any cost. It is the least data needed to finish the task without adding fragile request choreography.
CDN, edge caching, and cache invalidation
A content delivery network places cacheable data closer to users and absorbs repeated origin work. Static scripts, styles, images, fonts, and public documents are natural candidates. Some shared API responses can also work at the edge when their authorization and freshness rules are explicit.
Define cache keys around every dimension that changes a response, such as locale, encoding, tenant, permission, or query parameters. Set TTLs from the content's acceptable staleness. Document purge behavior, version assets with immutable URLs, and decide whether stale content may be served during revalidation or origin failure.
A safe caching strategy must prevent private responses from entering a shared cache. Do not place personalized data behind a broad key or trust a default cache rule without testing it. Verify misses, hits, expiry, invalidation, logout, role changes, and cross-account requests. Edge speed is worthless if one user receives another user's data.
Improve Server and API Performance
Back-end performance work begins inside a representative slow request. Break down handler time, database time, downstream calls, queue waits, serialization, and connection acquisition. Average server response time can look healthy while the p95 blocks a meaningful share of users.
Profile database queries with real data volumes. Inspect query plans, indexes, row counts, lock waits, and repeated queries. Right-size connection pools rather than increasing them blindly, since too many active connections can push the database into contention. Remove duplicate work and pre-compute stable aggregates when freshness requirements allow it.
- Move email, report generation, and other noninteractive work to queues.
- Cache expensive shared results with explicit invalidation rules.
- Set timeouts for downstream dependencies and measure their p75, p95, and p99.
- Test API percentiles at expected and peak load, including errors and saturation.
Good web application acceleration improves the whole distribution. A fast response in an idle test says little about application performance optimization under concurrent traffic.
Optimize JavaScript and Main-Thread Work
Front-end performance often degrades as bundles collect features, libraries, analytics, and duplicate utilities. Split code by route or capability, lazy-load work that is not needed for the first task, and remove dependencies that cost more parse and execution time than they save in development.
The browser treats work longer than 50 milliseconds as a long task. Google's long-task guidance recommends breaking large units into smaller tasks so the main thread can process input sooner. Move CPU-heavy parsing or calculations to a worker when transfer overhead and implementation cost are justified.
- Measure bundle bytes, parse time, execution time, and long tasks together.
- Yield between independent batches of work.
- Virtualize large rendered collections instead of creating every node.
- Test on low-end phones and typical office laptops, not just developer hardware.
Code splitting can backfire if it creates a deep chain of late requests. Validate the user journey after each change and watch INP as well as loading metrics.
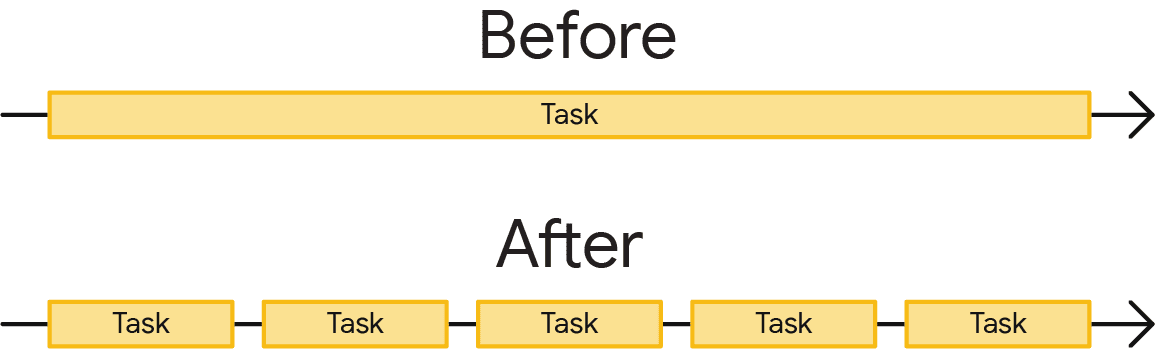
One long browser task compared with the same work split into shorter tasks (Source)
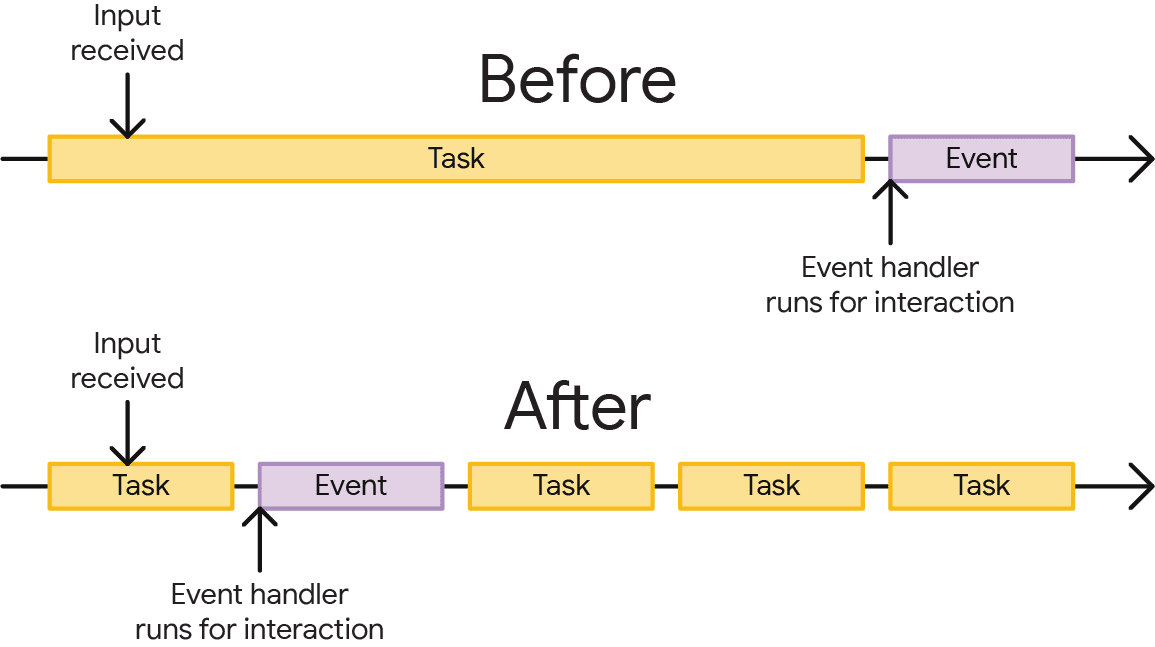
Shorter tasks allow an interaction handler to run sooner (Source)
Optimize Rendering and Asset Delivery
Rendering strategy should follow data and product constraints. Pre-rendering is efficient for content known before a request. Server-side rendering supports request-time data and can show useful HTML early, but it consumes server capacity.
Streaming can reveal ready sections while slower data continues. Client-side rendering fits highly interactive states but can delay useful content behind JavaScript.
Optimize images with correct dimensions, responsive sources, compression, and modern formats. Preload only truly critical assets. Subset fonts, limit weights, use an appropriate display policy, and inline only the small amount of critical CSS needed for initial rendering.
- Reserve image and embed dimensions to prevent layout shifts.
- Avoid injecting banners above content after the page settles.
- Remove render-blocking resources that add no early value.
- Check hydration and rerender costs on data-heavy screens.
Core Web Vitals help reveal the outcome, but they do not choose the architecture. Website speed optimization needs to account for personalization, cacheability, operational cost, and the critical content on each route.
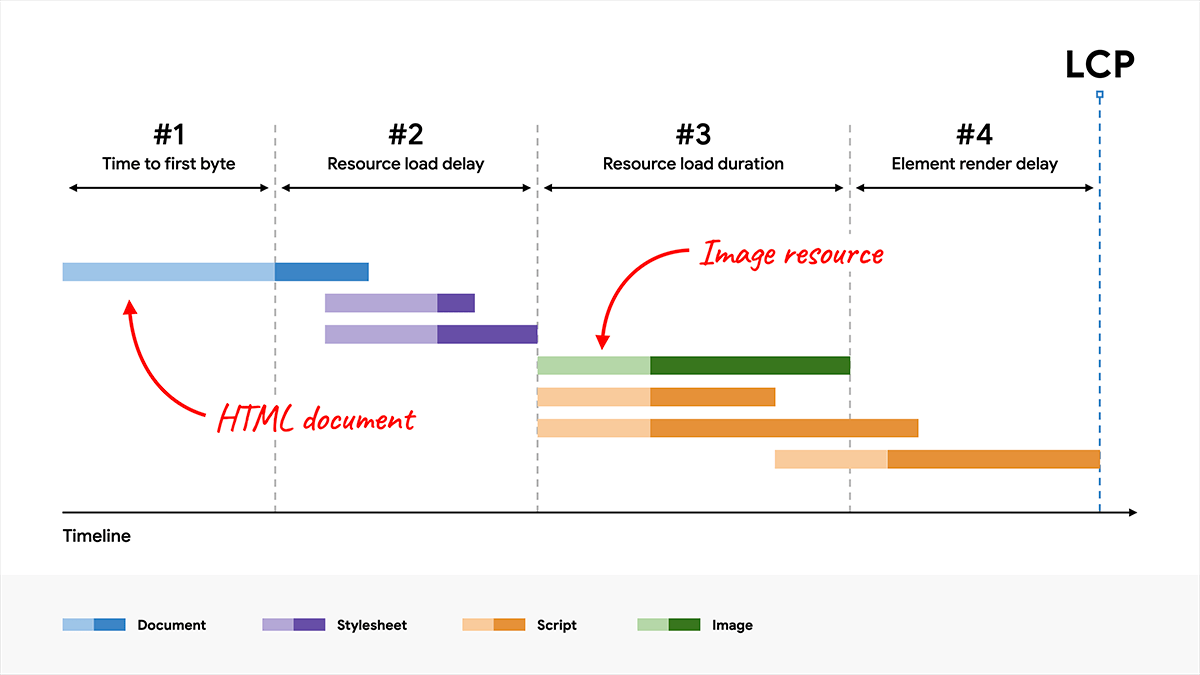
Largest Contentful Paint divided into server, resource, and rendering subparts (Source)
Optimize Data-Heavy B2B Interfaces
Large tables and charts can overwhelm the network, browser memory, and main thread at once. Paginate or cursor through records, virtualize off-screen rows, and request only columns visible in the current view. Apply filters on the server when downloading the full dataset would waste time and bytes.
Partial updates reduce repeated transfers. Optimistic UI can make reversible actions feel immediate, but it needs a clear rollback when the server rejects a change. Keep expensive aggregation, file generation, and wide exports in background jobs with progress states and downloadable results.
- Cap chart points or aggregate them to the visible time scale.
- Rate-limit costly searches and exports per user or tenant.
- Cancel stale requests when filters change.
- Preserve keyboard access and selection state when rows are virtualized.
These choices connect front-end performance with back-end performance. Sending fewer rows saves transfer time, JSON parsing, rendering work, database load, and memory in the same interaction.
Design for Load and Failure
Acceleration changes must behave safely under pressure. Load balancers distribute work, while load shedding rejects optional or excess work before every instance becomes unresponsive.
Queues smooth bursts for jobs that do not need an immediate result. Graceful degradation can disable expensive charts or recommendations while keeping login and core records available.
Retries need capped exponential backoff, jitter, deadlines, and idempotency where writes are involved. An uncapped retry can multiply a dependency failure into a broader outage. Circuit breakers can stop repeated calls to an unhealthy service, but fallback behavior and recovery thresholds need tests.
- Load-test the critical journey and its dependencies together.
- Confirm cache misses do not overload the origin after a purge.
- Model queue growth and recovery after a spike.
- Track saturation, timeouts, dropped work, and user-visible errors.
Latency reduction is incomplete if it weakens resilience. Review whether a new edge rule, cache, replica, or asynchronous path creates a new way for failures to cascade.
Performance Case Study: Slow Analytics Dashboard
Consider a fictional dashboard with four sequential stages. Login takes 700 milliseconds, the main query takes 2,100 milliseconds, JavaScript download and execution takes 1,400 milliseconds, and chart rendering takes 800 milliseconds. The initial end-to-end latency budget is 5,000 milliseconds.
The team parallelizes safe login setup, adds an index and narrower query, splits the chart module, and aggregates chart points on the server. The revised budget is 2,250 milliseconds: 450 milliseconds for login, 800 for the query, 650 for JavaScript, and 350 for chart rendering. These are scenario values, not promised results for another application.
| Symptom | Evidence | Change | Verification | Residual risk |
|---|---|---|---|---|
| Slow login | Trace shows serial profile and policy calls | Parallelize independent reads | Login p75 falls from 700 to 450 ms | Cold identity provider calls |
| Late dashboard data | Query plan scans a large fact table | Add a selective index and narrower result | Query p75 falls from 2,100 to 800 ms | Index write cost |
| Unresponsive first interaction | Browser trace shows bundle parse and long tasks | Split chart code and remove a duplicate library | JS stage falls from 1,400 to 650 ms | More chunks on cold cache |
| Slow chart | DOM and layout time grows with point count | Aggregate points for visible range | Render stage falls from 800 to 350 ms | Fine detail requires drill-down |
The calculation makes tradeoffs visible. It also prevents teams from claiming a five-second gain when stages overlap. Web application performance should be measured at the task boundary after the component measurements improve.
Validate Performance Improvements
Compare equivalent traffic before and after the change. Match weekdays, regions, user segments, device classes, network conditions, page types, and account sizes. A release during a quiet period can appear faster because load dropped, not because the code improved.
Use feature flags, canary releases, or controlled experiments to isolate impact. Monitor latency distributions, Core Web Vitals, task completion, resource use, and errors together. Watch enough samples to cover natural variance, then record the observation window and cohort definition beside the result.
- Warm and cold caches can produce different conclusions.
- Seasonal traffic and customer imports can change data volume.
- Small samples make percentile comparisons unstable.
- Concurrent releases and third-party changes can confound the result.
Web performance optimization is an evidence loop. Keep the change only when it improves the intended journey without moving cost or failure elsewhere.
When Acceleration Is the Wrong Approach
An added acceleration layer is not always justified. Sensitive or highly personalized data may be unsafe to share-cache. Rapidly changing records may need freshness that eliminates most cache value. Low-traffic internal tools may not repay another vendor, configuration plane, and incident path.
Unpredictable personalization also makes cache keys hard to reason about. In those cases, fix the slow query, oversized response, serial call chain, or excessive browser work directly. A content delivery network cannot repair inefficient application code, and another cache can conceal stale-data bugs while increasing operational work.
- Estimate saved user time and origin load against service cost and staff time.
- Map data sensitivity and freshness before caching.
- Prefer root-cause repairs when a layer merely hides repeated computation.
- Decline complexity that the team cannot monitor or safely invalidate.
If the root cause requires broader engineering help, compare top web application development companies by relevant performance work, observability practice, and experience with your architecture. Hiring should follow a diagnosed need, not a generic promise of speed.
Conclusion
Web application acceleration works best as a disciplined sequence: define the critical scenario, measure end-to-end latency, locate the limiting layer, apply a focused change, and verify the result with comparable data. Repeat that sequence as traffic, features, and user devices change.
Application acceleration does not mean deploying every available cache, protocol, renderer, and optimization plugin. It means selecting the smallest change that improves the measured journey without weakening correctness, security, or reliability. Keep web app performance budgets near the code and service owners who can enforce them.
No technique produces identical gains across applications. A useful application performance optimization program makes uncertainty visible, checks tail latency and errors, and treats performance as a product outcome. That is how web application acceleration moves from a speed project to routine engineering practice.

Creates insightful, strategy-driven content that translates complex design and branding concepts into accessible knowledge, supporting Ramotion’s mission to elevate digital experiences.