The digital world we live in relies heavily on data. Several websites, applications, and services gather consumer data daily, understanding user behavior in various ways. The organizations that still need to embrace this data revolution are nowhere to be found.
Data scientists are creating new algorithms and improving the existing ones to provide more insights, make better predictions, and create efficient designs. The field of user experience design has equally benefited from their expertise.
The existing design processes and methodologies can be improved by using data well. Collecting quality data from the users and performing good analysis has much power, enabling designers to create better overall experiences.
Modern organizations are looking for individuals who are experts in UX design processes and skilled in data-driven decision-making, understanding at least some nuances of data collection and analysis.
Working with a research-driven UX/UI design company ensures that both quantitative and qualitative data are interpreted through a human-centered design lens. This partnership helps balance statistical accuracy with empathetic, experience-led decision-making.
In this article, we introduce the concept of data-driven design. We start by defining the term and its importance for designers. We also discuss different types of data and how data-driven design can be incorporated into existing practices, taking care of several challenges in the process.
Read along as we introduce this highly relevant and fundamental concept.
What is Data-Driven Design and Why Does It Matter to UX?
The value of data for any modern organization cannot be overstated. In the last few years, with the emergence of fields such as data science and analysis, every field has incorporated data-driven decisions in its processes and methodologies.
The UI/UX design field is no exception, where data collection and analysis give valuable insights into user behavior, helping make better design decisions.
The data-driven approach is a new and popular approach in the UI/UX design field where the data collected and analyzed during different stages of the design process help make informed decisions.
Designers and design teams following this practice rely more on the insights gathered during data collection and analysis than on designers' intuition. The preferences of designers and their biases do not govern the design process. Instead, it is the data that drives the decisions.
Why does Data Matter in the Design Process
The data collected during the design process strongly impacts design decisions, helping the designers create innovative solutions. For executives hiring or partnering with a UX team, scanning how top UX design agencies demonstrate research-to-decision workflows can be a practical way to benchmark what “data-driven” execution looks like across real product engagements.
Whether working in a team or individually, designers can seek much help from data collected with techniques such as user research, usability testing, surveys, and contextual inquiry.
Similarly, when the users interact with the products regularly, designers can gather valuable data by conducting A/B testing, evaluating heatmaps, and analyzing the behavior of users as they interact with designs.
Data-driven decision-making is gaining popularity, and it is becoming increasingly important for designers to learn some skills and tools to help them create impactful solutions with the help of data.
Types of Data: Quantitative and Qualitative
We need to understand different data types before discussing how data-driven decisions can be incorporated into existing design methodologies to create better solutions. Getting a better understanding of these data types helps in making informed design decisions.
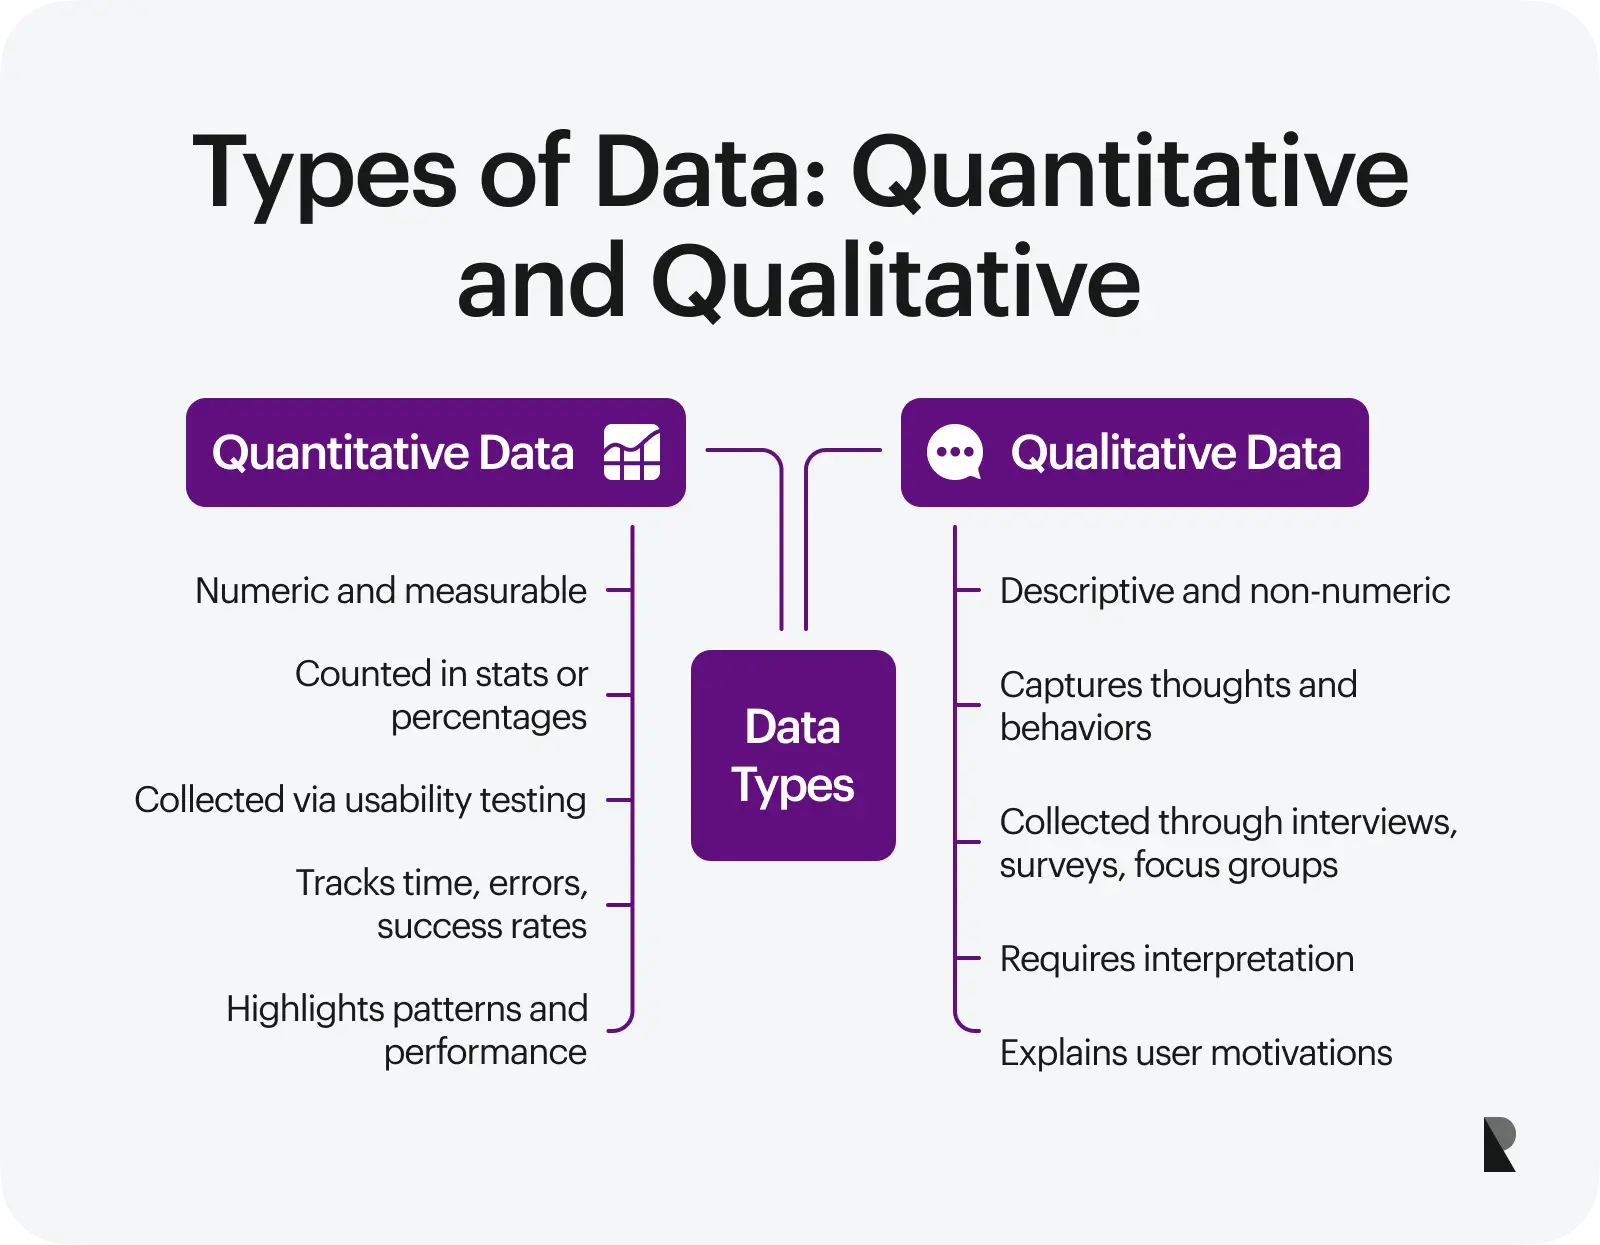
Two major types of data can be collected to understand user behavior: quantitative and qualitative.
These data types are defined based on the sources they come from, their distinguishing characteristics, and the methods applied to gather these data. Qualitative and quantitative methods govern the data collection process, guiding the overall design processes and decisions.
Quantitative and Qualitative Data (TolaData)
Quantitative data
Quantitative data is the type of data that can be counted or measured using arithmetic operations. This data can be represented in counts, percentages, and other similar ways. UI/UX designers can gather several insights by analyzing qualitative data.
One of the most common techniques designers use to collect quantitative data is usability testing. When conducting such tests, designers gather insights such as the time users take on tasks, the errors committed, and the success rate.
Qualitative data
Qualitative data is the type of data that cannot be counted; instead, it requires other techniques, such as textual analysis and visualization. Designers can gather qualitative data using specific methodologies, including user interviews, surveys, and focus groups. Regarding qualitative research, most data collection is gathered by contacting the users directly.
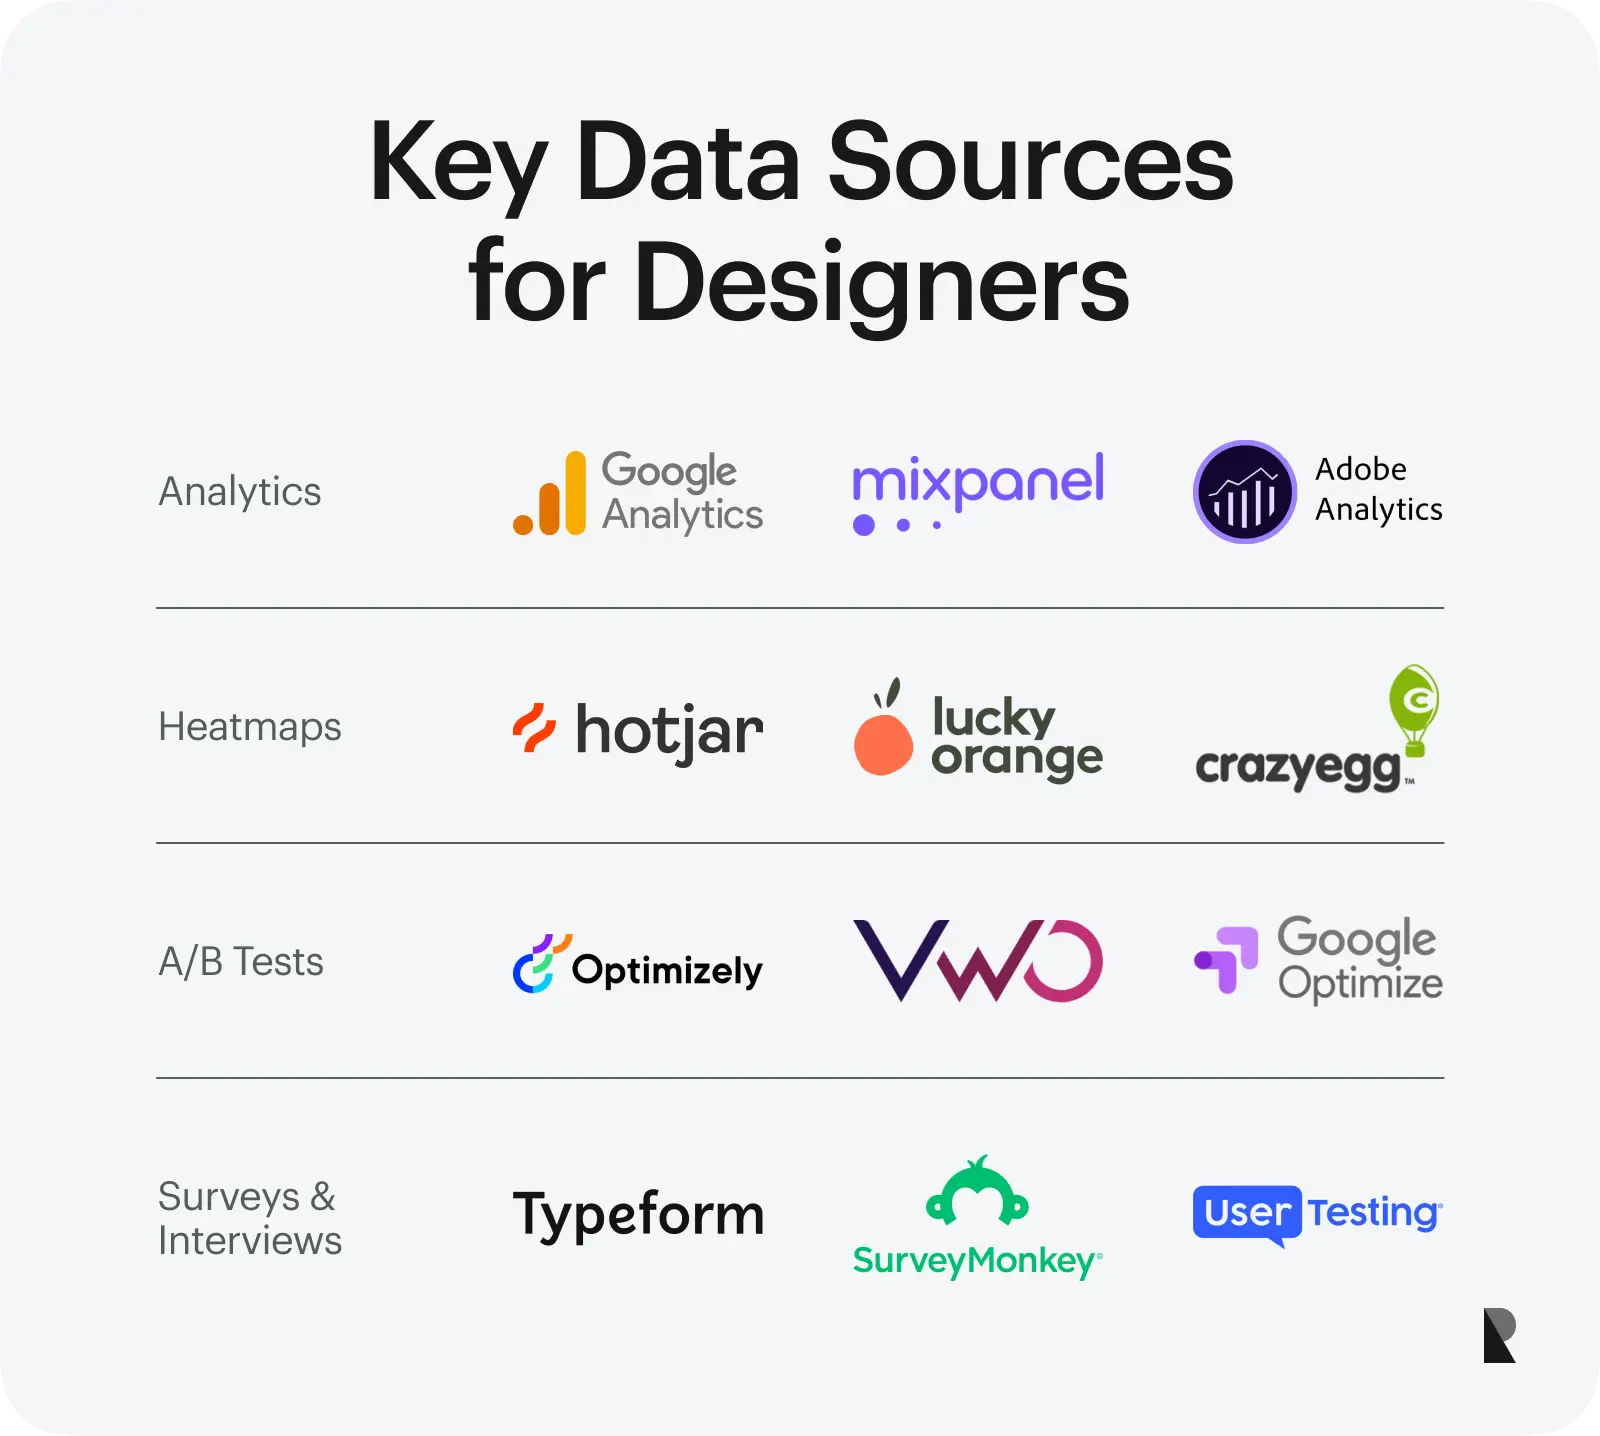
Important Data Sources for Designers
It is essential to consider the sources designers can use to gather quantitative and qualitative data. Designers can rely on several ways to make informed design decisions, including user interviews and usability testing.
Data Sources for Designers
Some of the most important and widely used data sources are as follows.
Analytics tools
Several tools, such as Google Analytics, help gather web analytics data that can give valuable insights into user behavior. Analytics data helps get important information, particularly quantitative data, such as the users' demographics, the devices they are using, the engagement level of users, and a lot more.
Heatmaps
Heatmaps are another critical way of understanding user behavior. Tools like Hotjar are beneficial in analyzing how users interact with online content. Heatmaps are particularly impactful regarding the user experience on websites, as these indicate how users respond to calls to action (CTAs) and interactive website content.
A/B testing
A vital methodology often used by designers, mainly when conducting comparative analysis, is A/B testing. By applying this technique, UX professionals can create two or more versions of a design and then observe how users interact with them. This can help assess each design's performance, thus helping the designers develop better solutions.
Surveys and interviews
Surveys, questionnaires, and interviews have long been a part of the design methodology. At several stages in the design process, gathering user feedback and understanding their interaction with the products and services is important. However, it is essential to be careful in designing surveys and interviews so the users feel valued and their feedback can be incorporated into design decisions.
Implementing Data-Driven Design
Now that we’ve discussed the types of data and the ways to collect valuable information from the target audience, it is important to consider how a data-driven approach can be implemented in design.
Some essential steps that can help adhere to a data-driven design process are as follows.
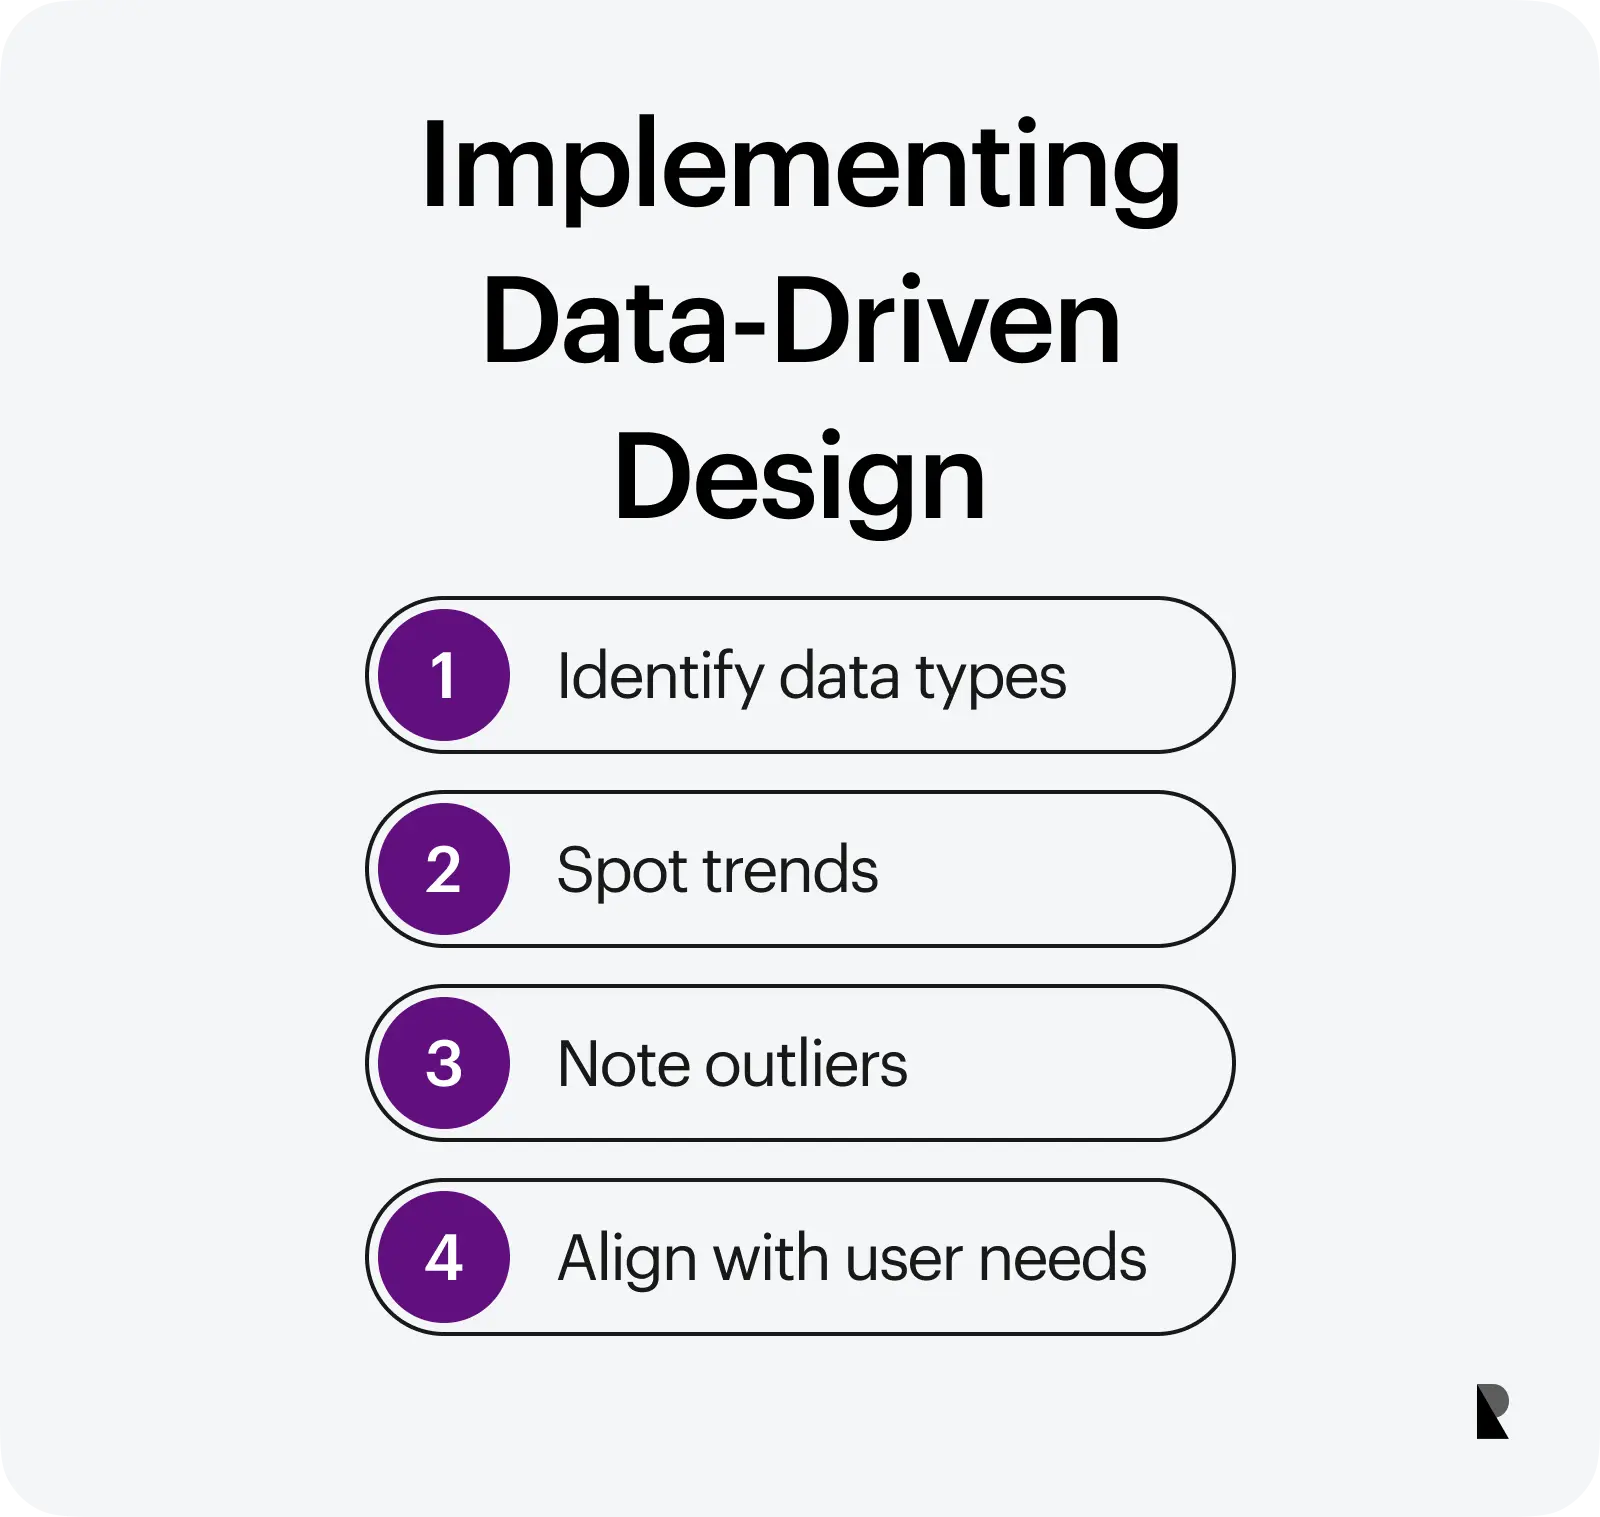
Understanding the Data
The first step in the process is to understand the nature of your data. This will help you know what you can expect from the data, how it applies to your overall goals, and where it comes from. This information is always helpful in devising a strong UX strategy.
Understand the type of data
To get a better understanding of the data, it is vital to figure out what type of data is being collected by the design team. Are you collecting qualitative or quantitative data? Is it coming from analytics software, such as Google Analytics?
Look for trends in the data
The next step is to sit with the data and look for the trends within the collected information. Are there any patterns in the data? Does the data follow specific trends that must be studied to understand user behavior? This can be achieved by conducting initial research and analysis, such as using multivariate and hypothesis testing to understand the trends.
Keep an eye on the outliers
Studying outliers in the data is always interesting – and necessary. Outliers tell us a story we might miss if we only look at the general trends. Looking at the outliers in any collected data helps understand the varying user needs, assisting designers in meeting the expectations of a wide range of audiences.
Refer back to the needs of users
An essential part of understanding the data is constantly monitoring the users’ needs and expectations. With the help of usability testing, interviews, or other methods, you can always gather user feedback and new data on the go. This will keep you updated with the users' needs, ensuring you do not miss important information.
Implementing Data-Driven Decisions in the Design Process
In the data-driven design process, designers can analyze data and the decision-making phase after collecting data, understanding it in depth, and getting a good idea of the user flow and needs.
However, the analysis will be half-cooked if the implementation of the process and the goals need to be more apparent. Let us take a look at the essential steps when it comes to making data-driven design decisions.
- Set clear goals: This step comes before designers and researchers collect data. Similar to any UX design process, adopting a data-driven approach will only be helpful if the goals are clear, as the design team can only achieve so much with more and more data without clear objectives.
- Collect data: A clear understanding of goals leads to gathering data that reflects user needs. This collected data – both qualitative and quantitative data – can then be analyzed by focusing on some testable statements.
- Analyze data and identify patterns: Analysis of raw data is essential to making design decisions. Techniques such as multivariate testing, hypothesis testing, split testing, etc., help get valuable insights into user behavior and patterns.
- Make data-driven decisions: The analysis conducted in the analysis phase leaves the designers with some actionable insights. For example, multivariate testing will highlight whether there is a causal relationship between two variables impacting user behavior.
- Iterate and refine the results: The UX design process is always iterative. The same holds for data-driven design processes. So, once the design team collects and analyzes data, the design decisions are made and tested. The evaluation will then highlight shortcomings that can be resolved iteratively.
Challenges and Balancing Acts
Dealing with data and making data-driven design decisions is always challenging. Several important aspects need to be considered to ensure that the creative nature of the design process is not compromised and that the data is utilized effectively and ethically.
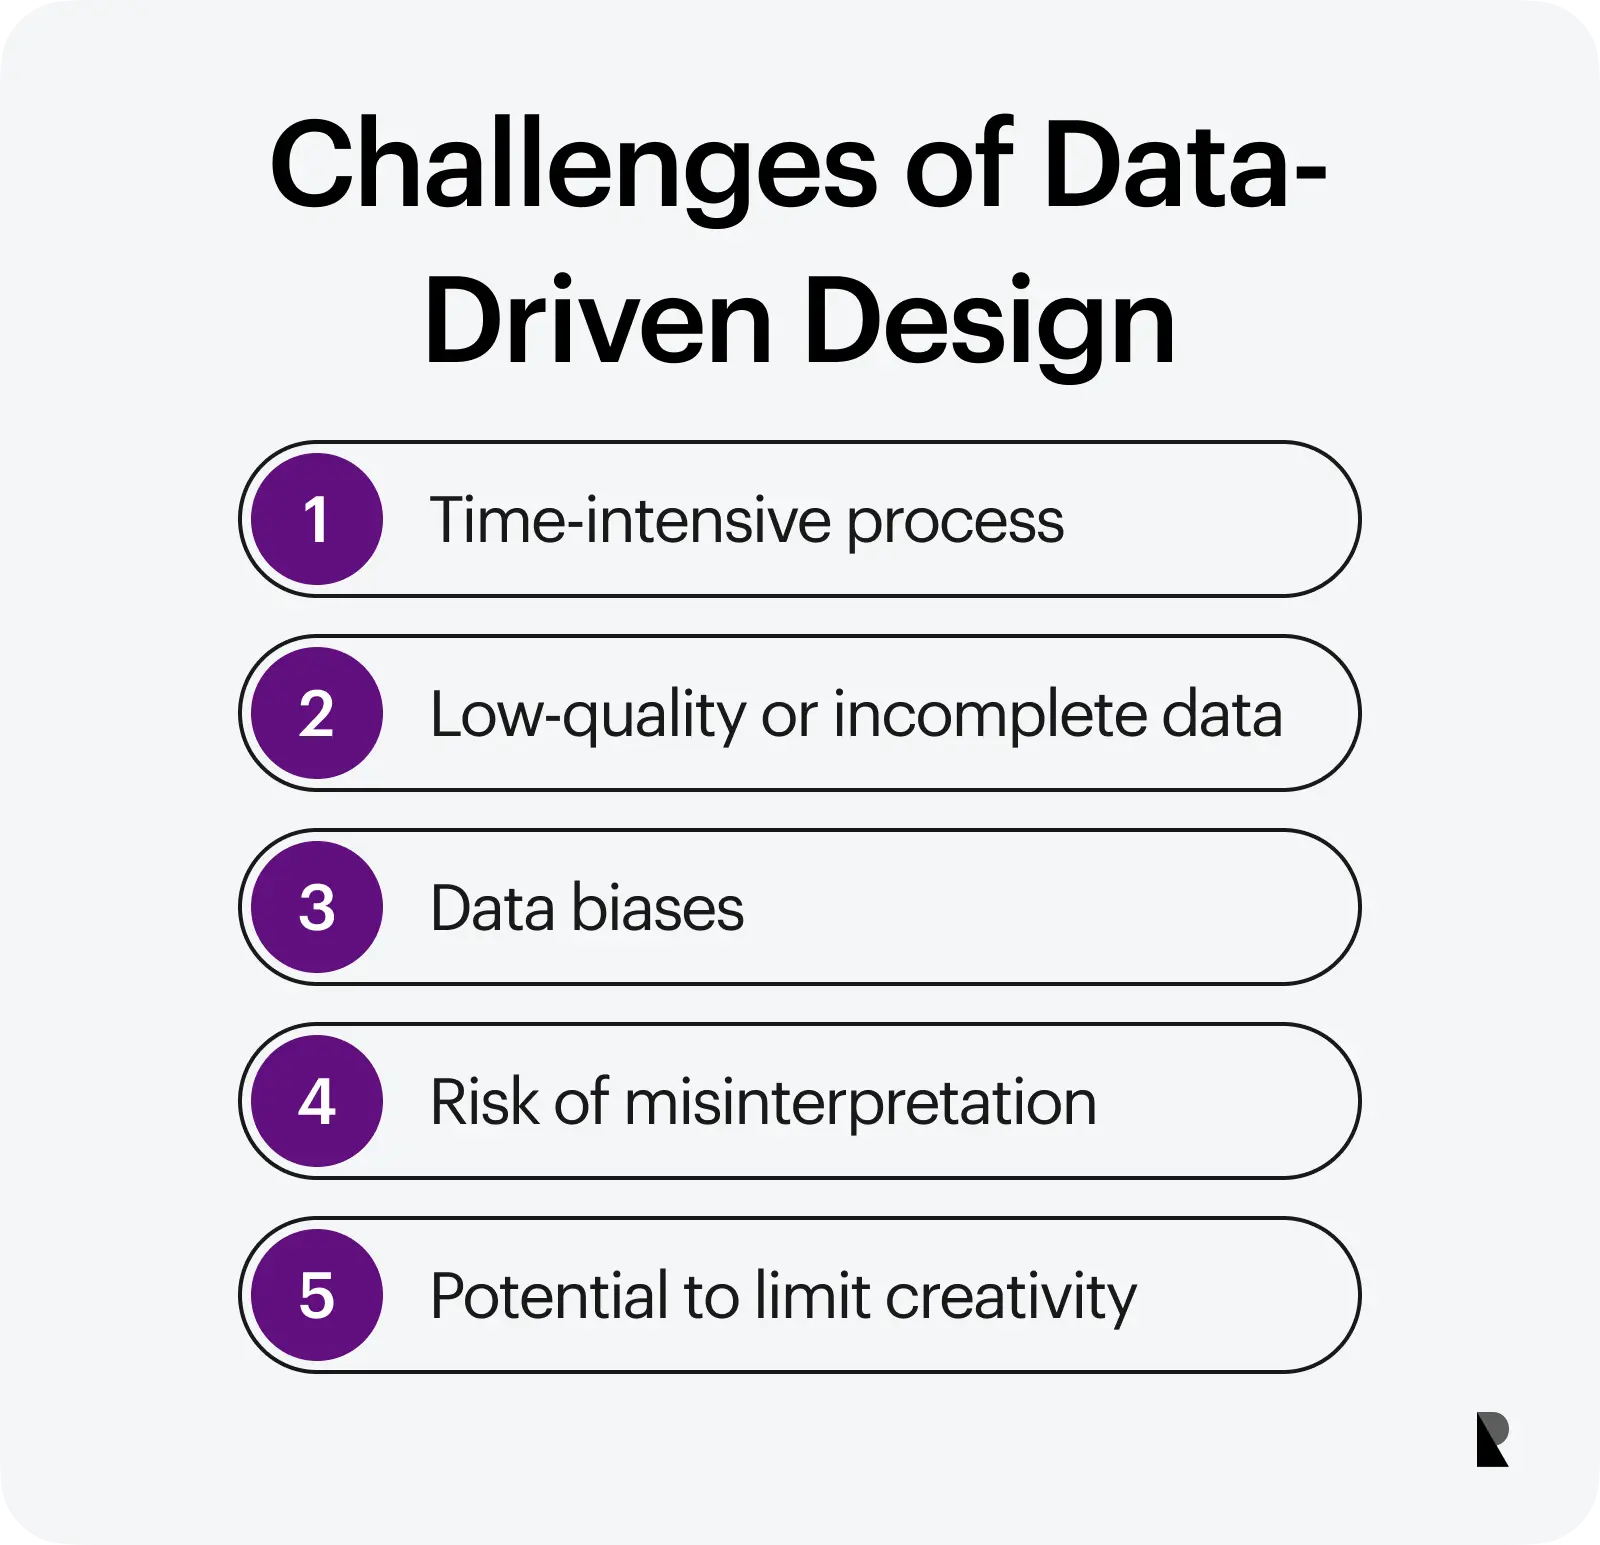
Challenges and Limitations of Data-Driven Design
Some of the important challenges when dealing with data-driven design are as follows.
- Time and effort: The time required to gather and analyze data is always challenging. Although quantitative data collection might still be more accessible, collecting qualitative data can be very time-consuming, thus slowing the design process down.
- Poor quality data: Data quality is also a significant challenge for designers and researchers. This applies to both qualitative and quantitative methods for data collection. Designers must take extra care to gather good quality data to keep user needs in mind.
- Biases in the data: When conducting user research and gathering data, the designers should acknowledge that the data can be biased. The biases of designers and users can both leave an impact on the design decisions. It is, therefore, critical to be aware of the biases.
- Lack of creativity: One repeat accusation on data-driven design processes – and, by extension, design teams – is that over-reliance on data results in a lack of creativity. This can impact the quality of designs, moving the designs away from the actual user needs and emotions.
Balancing Data-Driven Design with Creativity and Intuition
An important part of using data for design decisions and processes is understanding how reliance on data does not take away the emotional and creative elements of the UX design process.
This is where design teams can struggle. However, keeping certain best practices in mind and always focusing on the users' needs can help address this concern.
- Understanding the need to collect data (or not): Some organizations consider it everything when working with data. Designers, however, need to adopt a neutral attitude. There might be cases where a data-driven approach is optional. This is where design teams should make a case for more established, creative approaches instead of spending time and resources on data collection and analysis.
- Focusing on the basic principles of UX design: One of the best ways to ensure creativity in the design process is to return to the basic principles of UX design continually. Designers can make the most of techniques such as user research and user testing if they always adhere to UX design principles, where a user-centered approach always takes center stage.
- Taking a holistic approach: It is always an excellent approach to back data with intuition and vice versa. A holistic approach to UX design, whether dealing with qualitative or quantitative data, requires that designers' creativity, skills, and intuition be enhanced by data instead of being diminished or suppressed.
- Adopting an iterative approach: Design teams must always adopt an iterative approach when working with data. This means that user research should be conducted to ensure that the solutions created meet the users' needs. The designers can then make adjustments and improvements based on the feedback and interaction of users.
Engaging Stakeholders
One of designers' most important – and sometimes frustrating – jobs is engaging and convincing stakeholders when presenting their projects and recommendations. This holds for presenting data as well. UI/UX designers must learn how to present data impactfully and engagingly so the stakeholders can get the most out of it.
How can data be presented effectively to stakeholders?
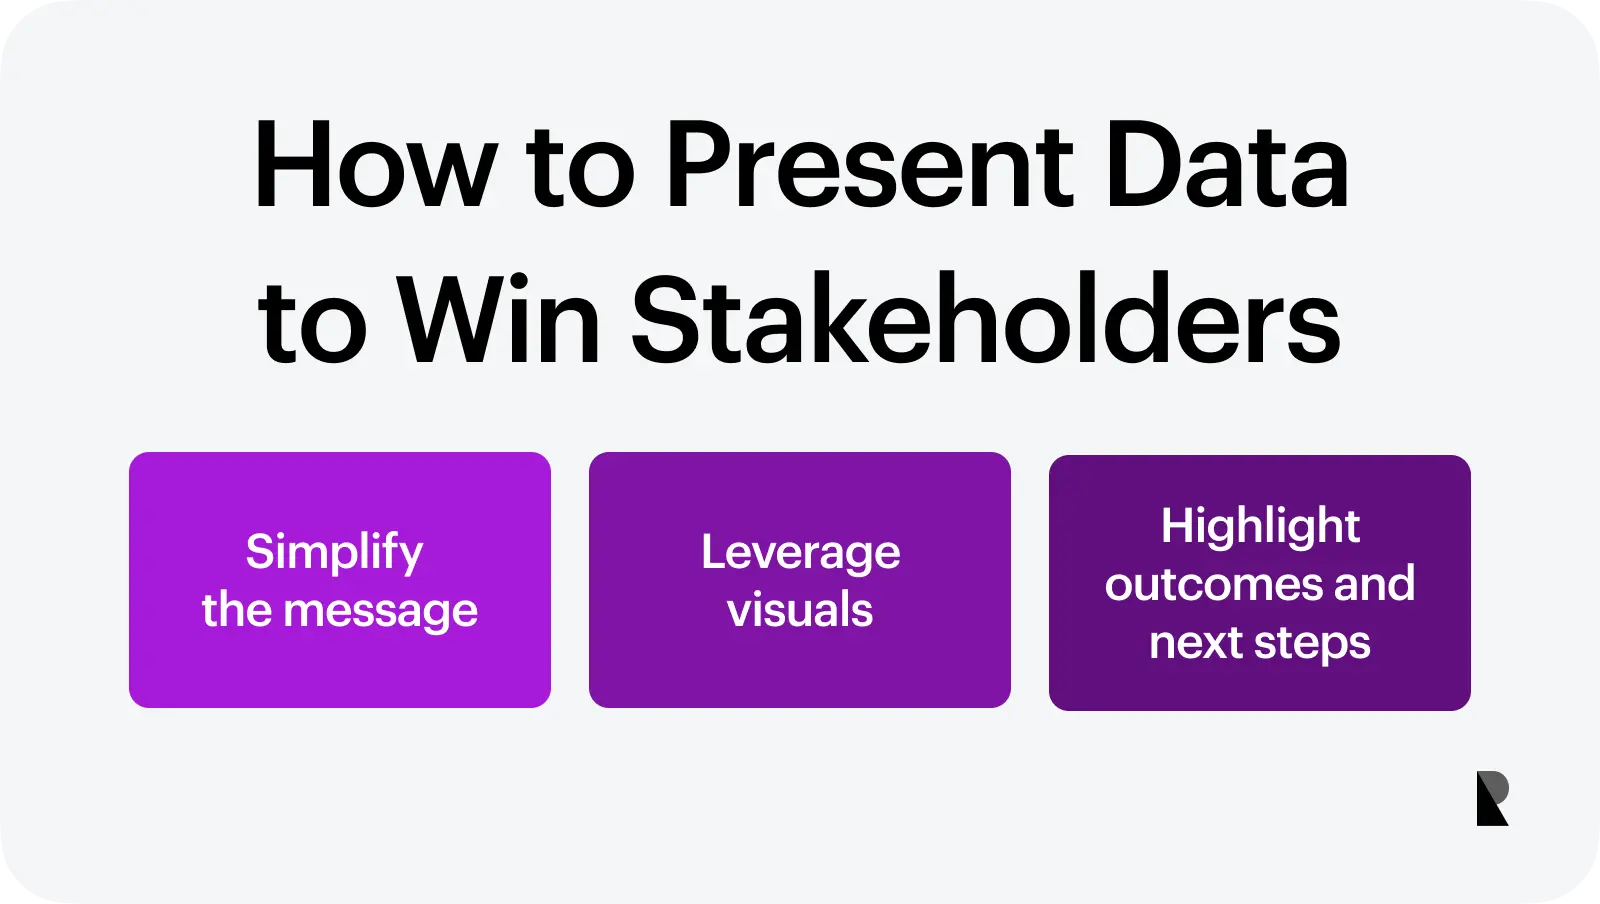
Some key strategies to present data effectively are as follows. 1. Keep things simple 2. Use the power of visuals. 3. Focus on results and recommendations.
How to Present Your Data to Win Stakeholders?
Some important guidelines to consider when presenting data to stakeholders are as follows.
- Keep things simple: Being a designer, it is crucial to understand that stakeholders are not design experts. Therefore, keeping things simple and presenting data using minimum jargon is always helpful.
- Use the power of visuals: Remember that pictures are worth a thousand words. When presenting data and designing solutions to stakeholders, use more visuals. This will make the content engaging and simplify the information for the audience.
- Focus on results and recommendations: In most cases, the stakeholders are interested in something other than the methodology and literature. Instead, results and recommendations matter the most. So, focus more on these aspects of the project, thus meeting the needs of your stakeholders.
Applying the strategies mentioned above will help you seek the support of stakeholders. You can always discuss the ROI of UX design and the need to incorporate data-driven solutions in the design field. This will help hook the stakeholders in, ensuring that the design departments and designers are noticed.
Conclusion
Data-driven design is a modern approach to UI/UX design. However, if we look closely, the data revolution is leaving its mark on the design field, just like in any other discipline. The importance of data science will only increase in the days to come. Therefore, as a UX designer, you must familiarize yourself with data-driven design and incorporate it into your projects.
In this article, we provided a detailed overview of the data-driven design process and how it impacts the design of products and services. Aspiring designers can explore this topic further to add to their knowledge and skill sets.

Creates insightful, strategy-driven content that translates complex design and branding concepts into accessible knowledge, supporting Ramotion’s mission to elevate digital experiences.